Blood Sugar Conversion Chart: Mg/dL, Mmol/L & A1C
Key Takeaways
- Mmol/L to mg/dL conversion: To convert a glucose reading from mmol/L to mg/dL, multiply the value by 18.
- Mg/dL to mmol/L conversion: To convert a glucose reading from mg/dL to mmol/L, multiply the mg/dL value by 0.0555.
- A1C to average glucose: An A1C percentage reflects a 90-day average, where a 6.0% A1C is roughly equivalent to an estimated average glucose of 126 mg/dL.
Stop guessing what works for your body
Do you feel you’re doing everything right and still not getting results?
pay $0 out-of-pocket
A1C to Glucose Conversion Chart
An A1C conversion chart translates your Hemoglobin A1C percentage into an estimated average glucose (eAG). While A1C reflects your average blood glucose over the past 2–3 months, eAG converts that percentage into the same units (mg/dL or mmol/L) you see on your daily meter.
Note: These figures are estimates based on ADA standards. Individual biology varies.
{{rich-text-cta-2="/style-guide"}}
3 Important Readings to Consider On A Blood Sugar Conversion Chart
It’s important to understand how different blood glucose values may impact your health, since high or low blood sugar levels can have serious implications for your metabolic health and overall wellbeing.
While normal blood glucose values may vary slightly for each person, there are a few ranges you should be aware of that can help you determine if your blood sugar is optimal.
Fasting Blood Glucose Levels: 70-99 mg/dL
Blood glucose levels between 70 to 99 mg/dL, or 3.9 to 5.5 mmol/L, are considered to be normal for adults without diabetes. Some researchers have argued for a a smaller range of 70 to 90 mg/dL, to potentially lower the risk of developing prediabetes or type 2 diabetes.
Although these levels are considered optimal, fluctuation is normal and certain individuals may thrive at different blood glucose values within this range. Remember that many factors can affect your blood sugar, and there are also ways to improve your blood sugar levels over time.
However, before making significant dietary or lifestyle changes, consult with a healthcare professional or registered dietitian to discuss your individual health needs.
Fasting Blood Glucose Levels: 100-125 mg/dL
Fasting blood glucose levels between 100 to 125 mg/dL, or 5.6 to 6.9 mmol/L, are considered elevated and are classified as outside of the normal range. This range may indicate or lead to the onset of prediabetes. A prediabetes diagnosis can put you at a greater risk of developing type 2 diabetes, high blood pressure, blood lipid disorders, and other adverse conditions.
People with elevated fasting glucose levels may want to have a conversation with a healthcare professional or a qualified dietitian or nutritionist about making lifestyle changes to stabilize their levels.
Fasting Blood Glucose Levels: 126 mg/dL or Higher
Fasting blood glucose levels of 126 mg/dL (or 7.0 mmol/L) or higher are often associated with type 2 diabetes. This indicates the body may be experiencing significant insulin resistance or an inability to regulate glucose effectively.
It depends on your unique context. Elevated fasting glucose can result from insulin resistance, the "Dawn Phenomenon," stress, poor sleep, or genetics. Identifying the root cause often requires more than a single reading.
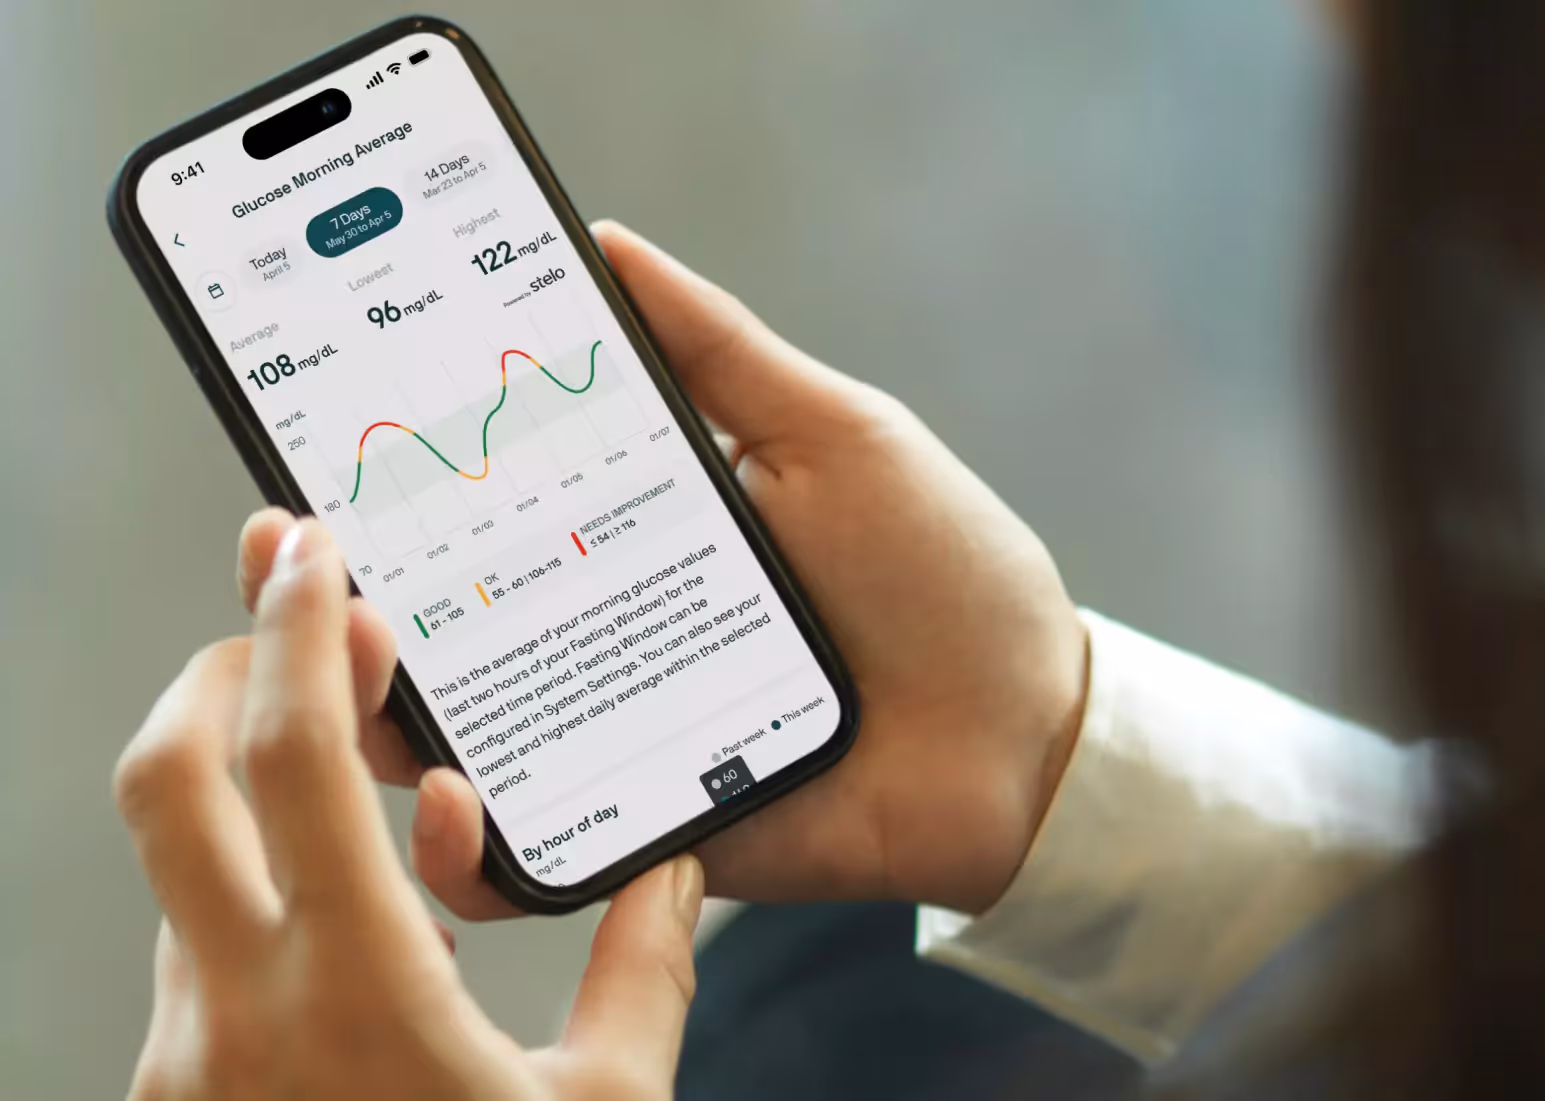
Why "Averages" (A1C) Don't Tell the Whole Story
Yes, your A1C matters, but it has a blind spot: variability. Two people can have the exact same A1C (e.g., 5.5%), but very different metabolic health profiles. One might have stable glucose all day, while the other experiences extreme spikes and crashes that "average out" to a normal number. This is called glycemic variability. A continuous glucose monitor (CGM) captures these daily fluctuations that a simple conversion chart or spot-check might miss.
{{rich-text-cta-member-stories="/style-guide"}}
Understanding the Difference Between Mmol/L and Mg/dL
Both mg/dL and mmol/L are used to measure blood glucose levels in slightly different ways. However, the main distinction is simply in which area of the world each measurement is used.
The measurement of mmol/L measures the concentration of blood glucose, or the number of molecules, in one liter of blood. In contrast, the measurement mg/dL measures the concentration, or the ratio of the weight of blood glucose to liters.
Important Formulas to Keep in Mind

Knowing the difference between these two different measurements and how to calculate them can be important as you deepen your understanding of blood sugar levels and their effect on the body.
If you don’t have access to a blood sugar conversion chart, here are two simple formulas to help you switch between these two different measurement units with ease.
Formula to Calculate Mmol/L From Mg/dL
1 mmol/L of blood glucose is equivalent to 18 mg/dL of blood glucose. So, if you're trying to calculate mmol/L from mg/dL, you can multiply the mg/dL value by 0.0555 to get the equivalent mmol/L value of blood glucose.
Here’s an Example Calculation:
105 mg/dL x 0.0555 = 5.83 mmol/L.
If you recall the blood glucose ranges we discussed, this value would fall into the prediabetic range.
Formula to Calculate Mg/dL from Mmol/L

On the other hand, if you’re trying to convert from mmol/L to mg/dL, simply multiply the mmol/L number by 18.
Here’s a Sample Calculation:
4 mmol/L x 18 = 72 mg/dL blood glucose.
This value, as we discussed earlier, would fall within the normal adult range.
Stop guessing what works for your body
Do you feel you’re doing everything right and still not getting results?
pay $0 out-of-pocket
Get More from Your Glucose with Nutrisense
Understanding your blood sugar levels is crucial to help maintain your overall wellbeing. Monitoring glucose is one way to keep an eye on it. This is where signing up for a program like Nutrisense can make all the difference, especially with the 1:1 access to a team of glucose experts through 1:1 insurance-covered video calls with a registered dietitian or nutritionist. The team of glucose-certified experts is trained to work with your body’s data; you can see what is affecting your glucose levels and find actionable ways to balance them based on your unique needs.
With Nutrisense, you also get access to glucose biosensors that measure interstitial glucose, or you can connect any compatible continuous glucose monitor (CGM) to the Nutrisense App and unlock powerful insights into your glucose levels. To read your glucose conversion charts, you can work with Nutrisense's credentialed experts, who are all glucose-experts and have various specialties, from weight loss and prediabetes to sports nutrition, women's health, and more. They provide personalized support to help you interpret your data and make informed lifestyle choices, so you have the tools and guidance you need to optimize your health.
Ready to get started? Take our quiz to see how Nutrisense can help you achieve your health goals.
Frequently Asked Questions
What is mg/dL?
Mg/dL stands for milligrams per deciliter, the standard unit of measurement for blood glucose in the United States. It represents the concentration of sugar based on weight in a specific volume of blood. Monitoring your individual response in mg/dL helps identify how certain foods impact your overall metabolic stability.
What does mmol/L mean?
Mmol/L stands for millimoles per liter, the international standard unit for measuring glucose concentrations. Instead of weight, it measures the number of glucose molecules in a volume of blood. Knowing this measurement is essential when comparing your data to global health and medical guidelines.
What are normal fasting glucose levels?
Normal fasting glucose levels are between 70 to 99 mg/dL, which converts to 3.9 to 5.5 mmol/L. Values above 100 mg/dL may indicate prediabetes or impaired metabolic function. However, individual glucose responses vary, and tracking your trends provides a more complete picture than a single reading.
Go Beyond Glucose Data with Nutrisense
Your glucose can significantly impact how your body feels and functions. That’s why stable levels are an important factor in supporting overall wellbeing. But viewing glucose isn't enough. Nutrisense, you’ll be able to learn how to use your body's data to make informed lifestyle choices that support healthy living.
One-to-one coaching
Sign up to access insurance-covered video calls to work with a glucose expert: a personal registered dietitian or certified nutritionist who will help tailor your lifestyle and diet to your goals.
Monitor and measure what matters
With the Nutrisense CGM Program, you can monitor your glucose with health tech like glucose biosensors and continuous glucose monitor (CGM)s, and analyze the trends over time with the Nutrisense App. This will help you make the most informed choices about the foods you consume and their impact on your health.
Find your best fit
Ready to take the first step? Start with our quiz to find the right Nutrisense program to help you take control.

Heather is a Registered and Licensed Dietitian Nutritionist (RDN, LDN), subject matter expert, and technical writer, with a master's degree in nutrition science from Bastyr University. She has a specialty in neuroendocrinology and has been working in the field of nutrition—including nutrition research, education, medical writing, and clinical integrative and functional nutrition—for over 15 years.
Stop guessing what works for your body
Do you feel you’re doing everything right and still not getting results?
pay $0 out-of-pocket