Glucose Monitoring: Understanding AUC and Delta
Key Takeaways
If you’re familiar with blood sugar measurements, you may already be aware that keeping an eye on your glucose levels can support your overall wellbeing in a number of ways. After all, glucose is required for many physiological processes in the body and is your body’s main source of energy.
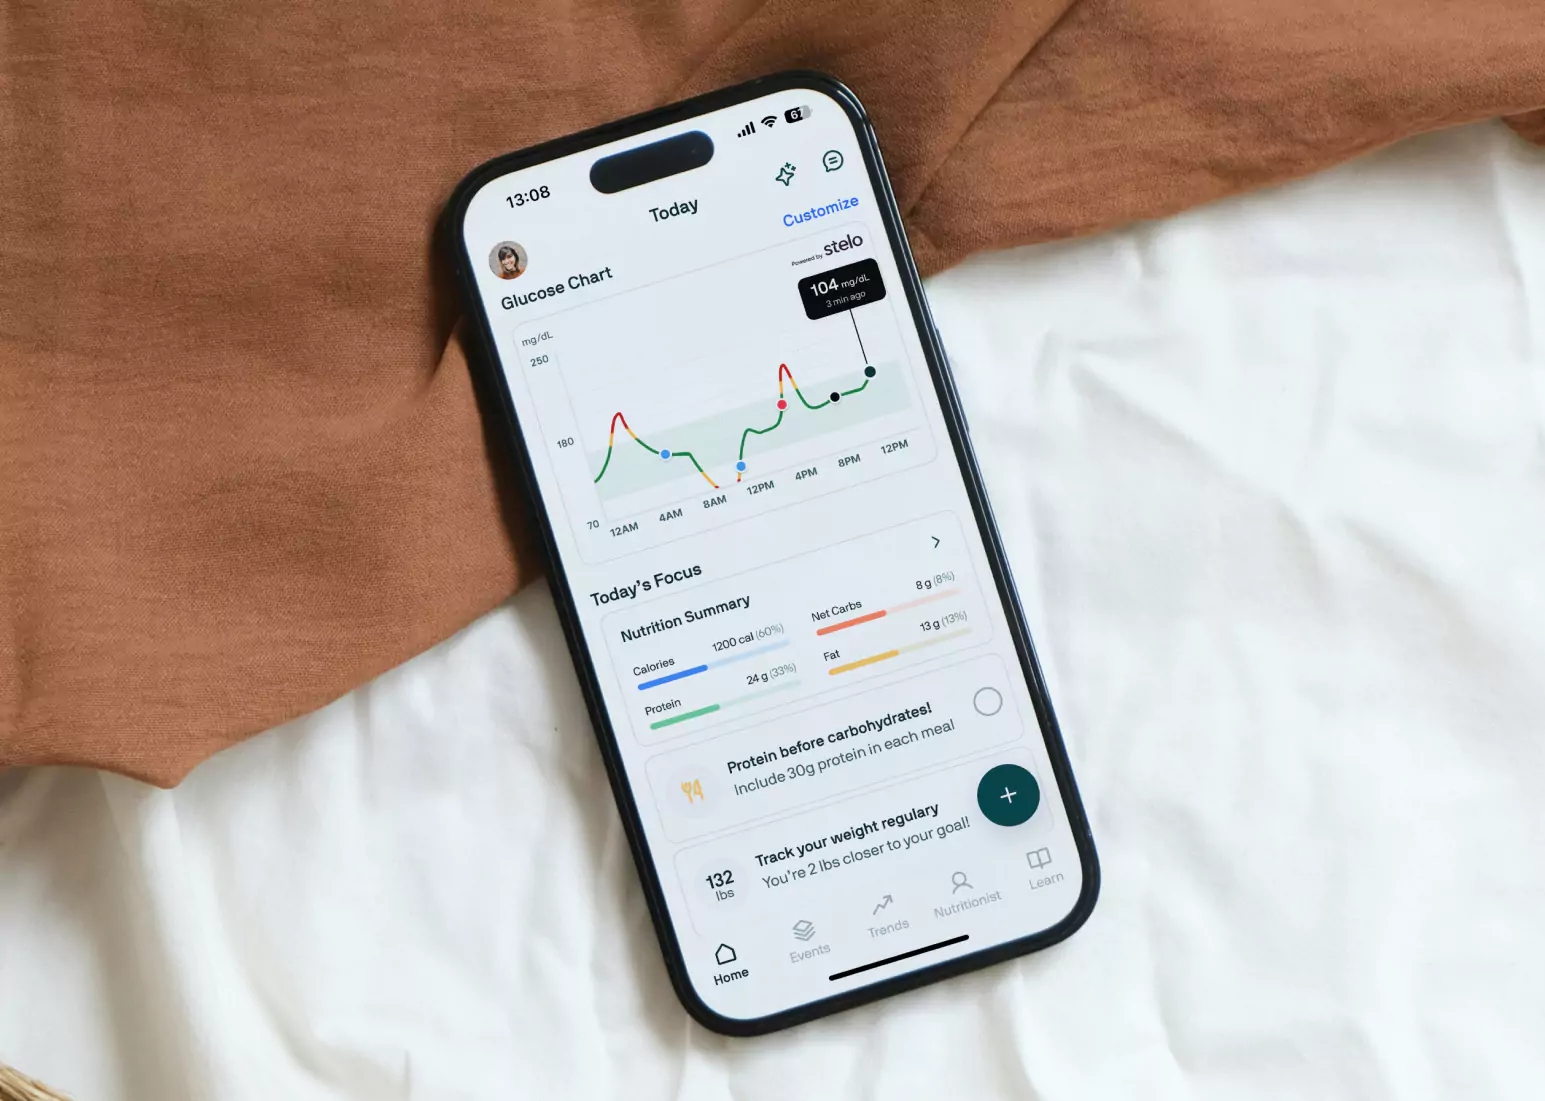
There are various methods you can use to gain insights into your blood sugar response. One way is through tracking glucose 24/7 via continuous glucose monitoring, which allows you to view your glucose with a small sensor.
A CGM sensor or a glucose biosensor can provide you with a lot of valuable data about your glucose, including values such as time in range (TIR), delta, area under the curve (AUC), and recovery time. But what does any of it even mean?! If you’re new to glucose monitoring, some of these numbers may feel overwhelming at first, and understandably so!
In this article, we’ll dive deeper into AUC and delta scores to help you understand what these two glucose monitoring metrics mean and why you might want to pay attention to them.
How Does a CGM Work?
Continuous glucose monitoring uses a device called a CGM or a glucose biosensor, both of which are sensors that stay attached to the back of your arm. CGMs and glucose biosensors measure interstitial glucose levels and allow you to see your glucose levels fluctuate throughout the day.
With a sensor like this, you can learn more about how your body responds to factors such as diet, exercise, sleep, and stress, and use this information to implement healthier lifestyle changes.
This is a different approach from using a blood glucose monitor (BGM), which involves pricking your finger and placing a blood droplet onto a strip. A BGM test reads your blood glucose levels in a given moment, rather than taking continuous readings over time.
Different Types of Glucose Tests
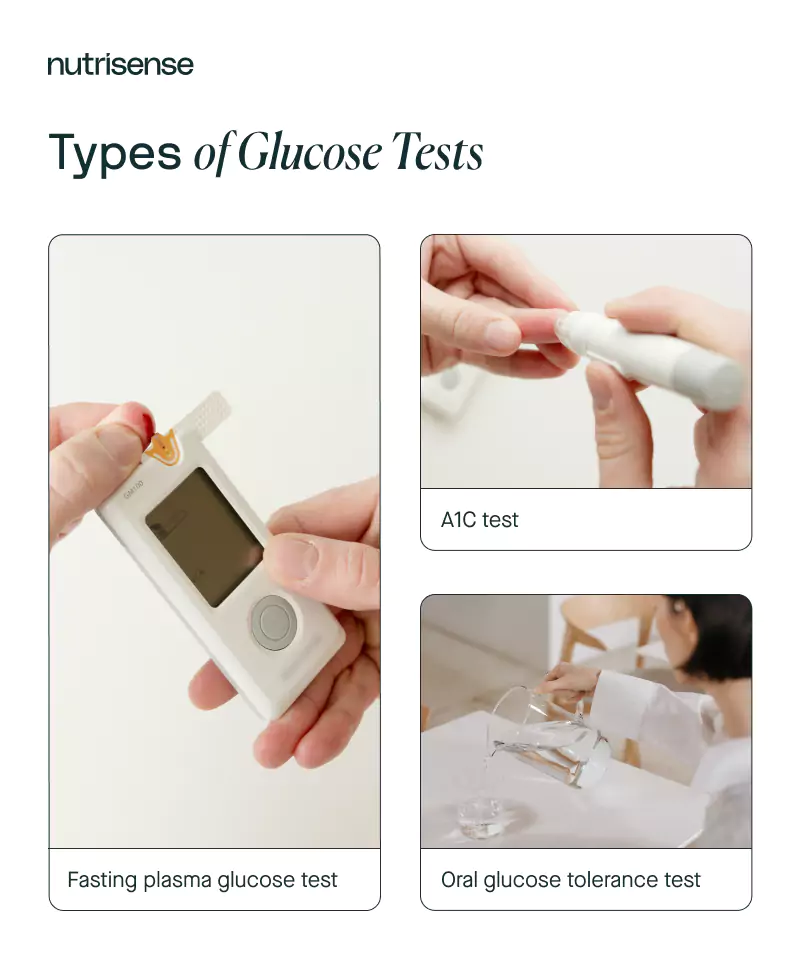
As we mentioned earlier, there are a number of different ways to take a closer look at your blood sugar if you want to stay on top of your health.
A1C testing and fasting blood glucose tests, which are typically conducted in a doctor's office or lab, are one option. Your doctor may use the HbA1c and FPG tests to diagnose conditions such as diabetes.
One downside to the HbA1c and FPG tests is that they may not be able to detect other glucose dysfunctions such as glucose intolerance when they first start developing. In the case of glucose intolerance, the oral glucose tolerance test or OGTT is usually used. However, the OGTT does not always provide the whole picture when it comes to glucose tolerance.
Assessing Your Glucose Response
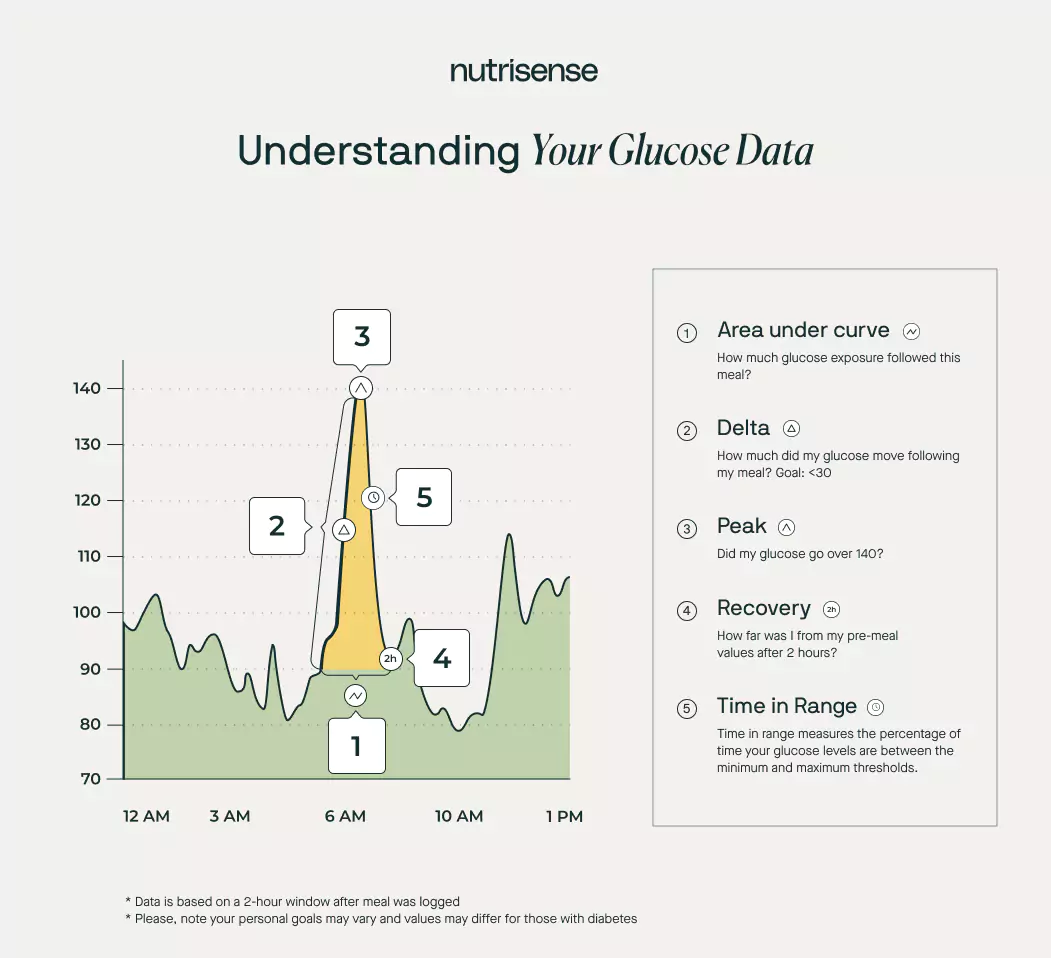
There are a few different metrics that are used when assessing your body’s glucose response, including:
- Time in range
- Area under the curve (AUC)
- Delta.
Time in range (TIR) measures the percentage of time your glucose levels are between the minimum and maximum thresholds. Research shows that the time in range can vary for those with diabetes and those without diabetes. For people with diabetes, the American Diabetes Association recommends staying within 70–180 mg/dL for at least 70 percent of the day.
With TIR, you can more easily see how much time your glucose levels spent outside of that threshold, and what foods or activities may have played a role in this. Your TIR may help you pinpoint what your body needs for your glucose levels to stay within range.
The American Diabetes Association recommends limiting episodes of hypoglycemia and hyperglycemia to improve this number. One in vivo study found those with type 2 diabetes who used a CGM for 24 weeks increased their TIR significantly.
While there wasn’t an impact on hypoglycemia specifically in this study, researchers believe that increased attention to glucose levels using a CGM may have led to an improvement of TIR.
Now that you understand the basics of time in range, let’s take a deeper look at two more important glucose metrics: area under the curve and delta.
What is Area Under the Curve (AUC)?
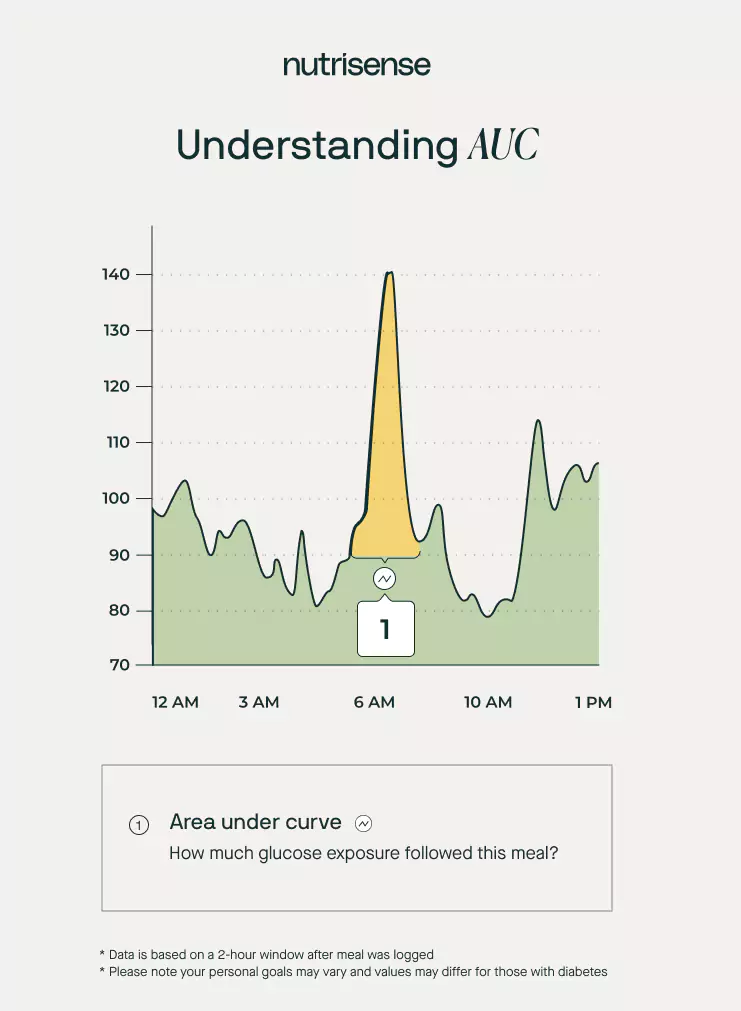
The area under the curve, or whole glucose excursion, is another important metric when it comes to your glucose. In the case of glucose data, the area under the curve measures how long it takes your body to use or store glucose after a set period of time following a meal.
The area under the curve can also be valuable after an oral glucose test, as it can help to get a better estimate of glucose tolerance. This measurement is used for calculating the glycemic index of foods. It may also be helpful in determining the effectiveness of postprandial hyperglycemia medications.
Researchers suggest aiming for a minimal AUC. However, there still isn’t sufficient evidence or firm data that points to precise numbers to aim for. More research is also needed to determine the exact AUC cutoffs for a more versatile group of healthy, or normoglycemic, individuals.
Similarly to AUC goals for healthy individuals, there also aren’t yet any target ranges for people with diabetes that are fully confirmed, and research is still ongoing. However, researchers have found success in measuring AUC using a continuous glucose monitor.
To make AUC a little easier to visualize, consider this example: a sharp but quick glucose spike may reach 150 mg/dL, but if your glucose returns to pre-meal values within an hour of eating, this is a small area under the curve.
On the other hand, a slow glucose climb to 130 mg/dL that stays elevated for five hours would be a much larger area under the curve. The Nutrisense dietitian team recommends aiming for your glucose to return to pre-meal values within three hours of eating.
At Nutrisense, we help our members gain insight into patterns in AUC levels. Research shows that striving for a relatively more minimal AUC may be ideal. More research is needed to verify the optimal range.
AUC: Key Takeaways
- AUC measures how long glucose takes to be used or stored in your body after a meal.
- A continuous glucose monitor (CGM) or glucose biosensor is one way to view your AUC value.
- Smaller AUC is currently considered to be optimal, but research is still ongoing.
What is Delta?
Another important metric to consider when looking at a breakdown of your glucose data is a measurement called delta. Your delta value illustrates the change in glucose levels within the two-hour window after eating.
Avoiding major "shifts" or spikes in glucose is recommended by researchers in order to keep your delta in range and lower your risk of type 2 diabetes. Based on research, the Nutrisense dietitian team suggests aiming for a delta score of 30 or less.
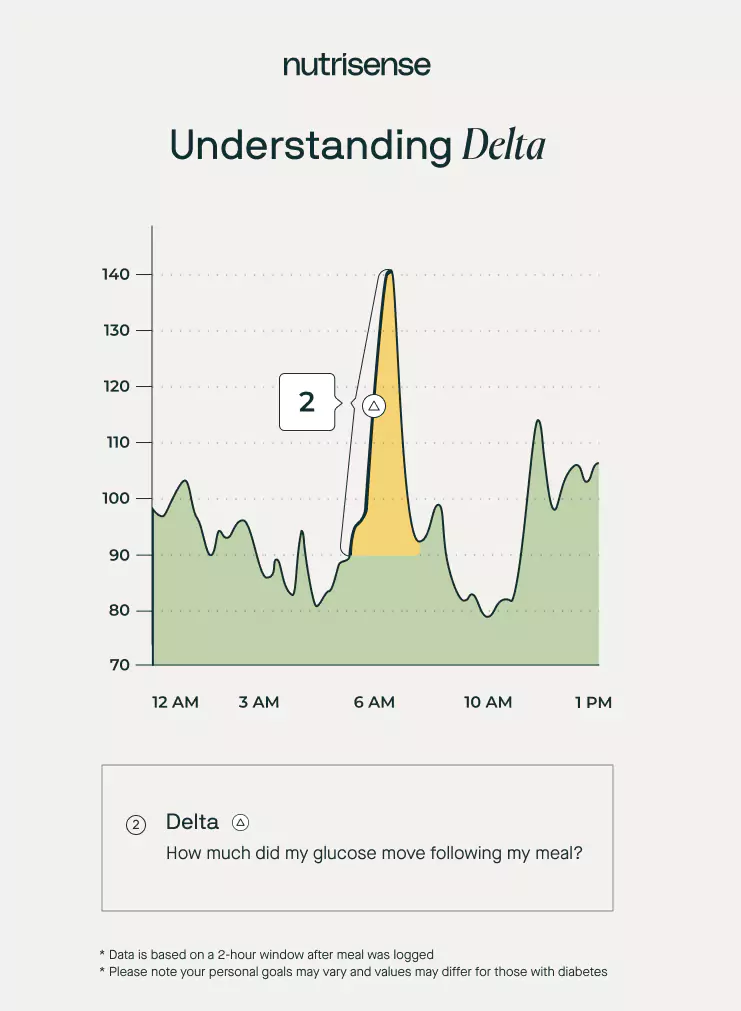
As you can see in the chart above, here’s what happened after one person ate a particularly carb heavy meal.
- Starting glucose of about 80 mg/dL
- Glucose spiked up to 140 mg/dL after their meal
- Their delta score equated to 60
This spike lead to a sharp increase in glucose, and about double the delta score that is recommended in preliminary research.
For example, in a study which investigated the typical delta levels in healthy non-diabetic adults, researchers found that the average post-meal glucose peak was 99 ± 10.5 mg/dL after a standardized balanced meal.
Although data is currently limited on non-diabetic glucose monitoring, the researchers of this study concluded that a 30 mg/dL increase from pre-meal levels may be an ideal target. More research is still needed, but this estimation serves as a good starting point.
Delta: Key Takeaways
- Delta measures how much your glucose levels change after eating.
- Your delta score can be impacted by lifestyle factors such as diet, exercise, and stress.
- Research is still ongoing, but healthy individuals (without diabetes) should aim for a delta of 30 or lower.
Five Things That Can Impact Your AUC and Delta Values
You know now that there are various factors that can impact your blood sugar and/or how long it stays elevated. Let’s take a closer look at a few of these factors and how they can impact your AUC and delta.
1) The Amount and Type of Carbs You Eat
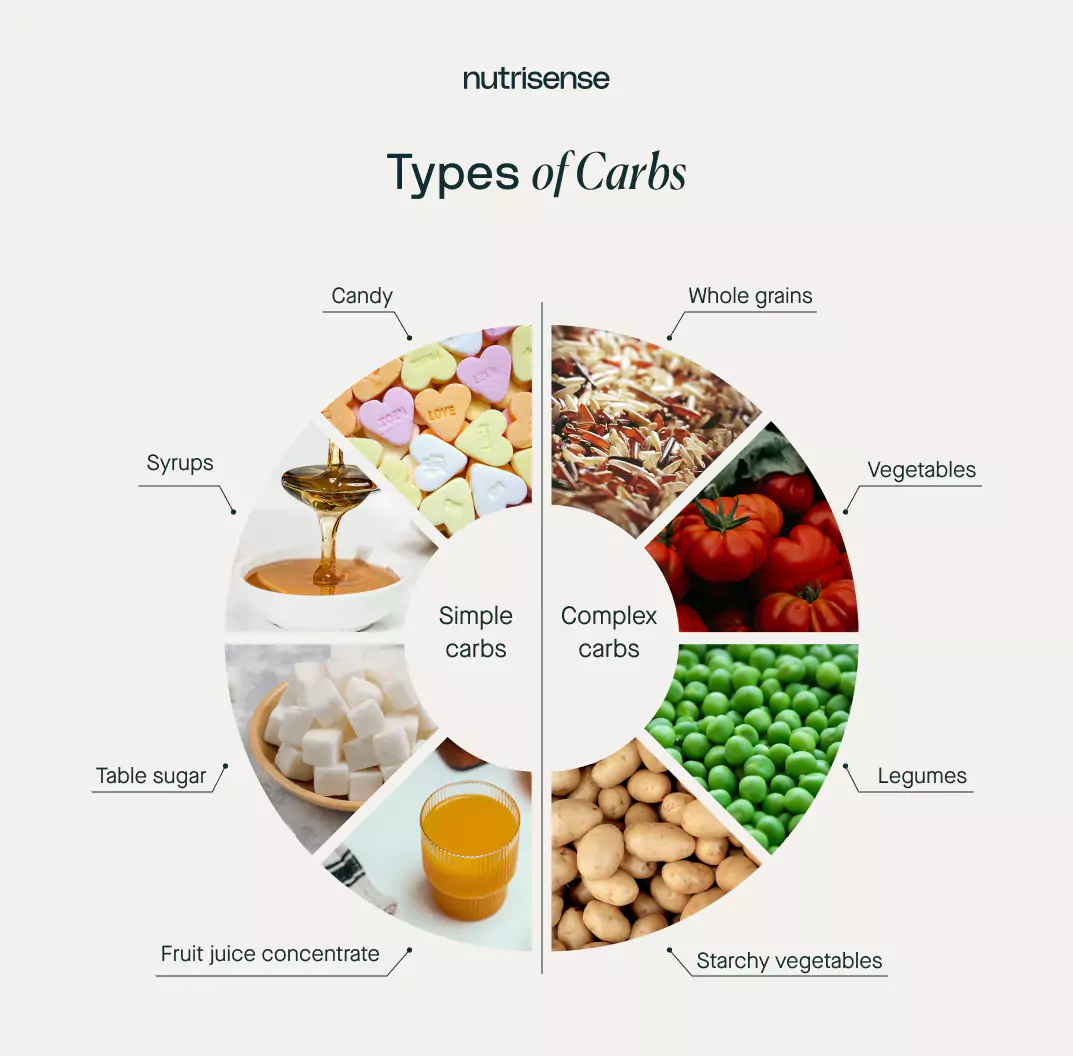
The amount and types of carbs you eat can affect your glucose levels and cause them to fluctuate, which in turn can impact your AUC and delta values. However, it’s important to remember that everyone is different and your sensitivity to carbs may vary.
Using a device like a CGM or glucose biosensor, which shows how your glucose responds to carbohydrates in real-time may be useful for some people. This sensor can help you learn what foods work best for your dietary needs in order to find your own personal sweet spot.
2) The Amount of Fats Consumed
The amount of dietary fat you consume can also have an effect on your blood sugar response. Studies suggest that a high fat and higher carb intake can delay glucose in returning to baseline when paired together.
Fat can slow down digestion by delaying gastric emptying. By delaying the absorption of carbs in this way, dietary fat may lead to a slower increase in blood glucose rather than a sharp spike.
Researchers have also found that consuming a moderate amount of carbs with fats paired may promote satiety, or feeling of fullness, and help increase glucose stability. However, for those with more insulin resistance, the effect on blood glucose can worsen.
3) Time of Day

Insulin sensitivity may be lower later in the day, which means the body may take longer to process glucose and glucose may stay elevated for longer. This is why eating higher carb meals late in the day may not be as ideal for AUC.
One study monitoring insulin sensitivity over a 68-hour period found that insulin secretion peaks around mid-afternoon (specifically around noon to six p.m.), and decreases by night.
In another study, researchers used a glucose tolerance test in those with normal weight and found that insulin sensitivity was impaired up to 34 percent in the evening (when compared to the morning). These findings have been confirmed with additional tests like insulin tolerance. It appears that eating higher carb meals earlier in the day may lead to improved AUC and delta scores.
4) Meal Frequency
Another tip for improving your AUC and delta scores is experimenting with meal frequency. Specifically, researchers have observed that eating smaller portions throughout the day on a frequent, consistent basis may be better than large infrequent portions such as one large meal a day.
One study found that those who ate one large meal a day had higher fasting plasma glucose levels in the morning. These people also had higher glucose levels throughout the day and delayed insulin responses compared to those who ate three, smaller meals a day.
5) Meal Sequencing
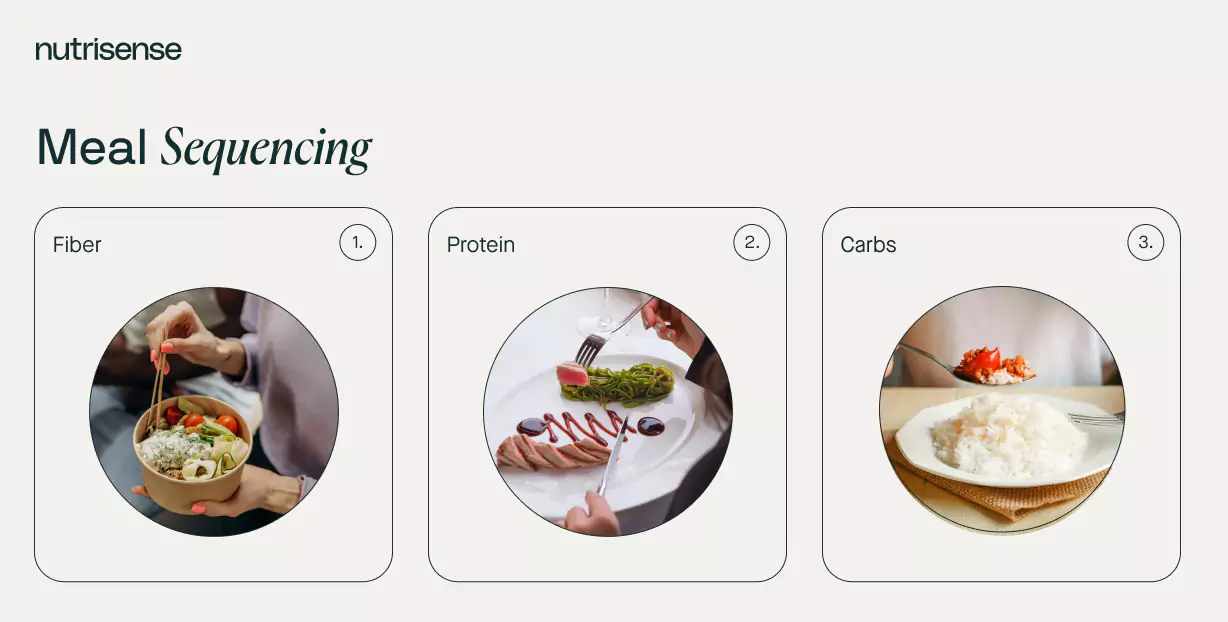
Meal sequencing, or consuming protein and fiber before carbohydrates in this case, may promote the secretion of glucagon-like peptide-1 (GLP-1). This hormone helps regulate how much insulin and glucagon is released.
The combination of these factors has been shown to improve postprandial, or post-meal, glucose responses. GLP-1 has also been shown to suppress appetite because it delays gastric emptying, which can help you feel full for longer.
This study also found that eating protein and non-starchy vegetables first can lead to lower postprandial glucose responses and insulin levels (compared to eating starchy carbohydrates first).
Important Considerations When Using a CGM or Glucose Biosensor
It’s important to note that these tips are general guidelines rather than absolute truth. The reality is that different people may have different responses (including AUC and delta values) to different foods, time of day, macro combos, and more.
One person may respond well to sweet potatoes while another may experience a poorer response. When using a glucose biosensor through the Nutrisense CGM program, it may be important to keep an eye on specific glucose spikes, as well as to look for patterns in your responses.
If you believe your AUC or delta values are outside of the normal ranges, consider consulting a qualified medical professional and a registered dietitian to help you find the right balance for your specific body.
Find the right Nutrisense programto turn insight into progress.
Go Beyond Glucose Data with Nutrisense
Your glucose can significantly impact how your body feels and functions. That’s why stable levels are an important factor in supporting overall wellbeing. But viewing glucose isn't enough. Nutrisense, you’ll be able to learn how to use your body's data to make informed lifestyle choices that support healthy living.
One-to-one coaching
Sign up to access insurance-covered video calls to work with a glucose expert: a personal registered dietitian or certified nutritionist who will help tailor your lifestyle and diet to your goals.
Monitor and measure what matters
With the Nutrisense CGM Program, you can monitor your glucose with health tech like glucose biosensors and continuous glucose monitor (CGM)s, and analyze the trends over time with the Nutrisense App. This will help you make the most informed choices about the foods you consume and their impact on your health.
Find your best fit
Ready to take the first step? Start with our quiz to find the right Nutrisense program to help you take control.

Heather is a Registered and Licensed Dietitian Nutritionist (RDN, LDN), subject matter expert, and technical writer, with a master's degree in nutrition science from Bastyr University. She has a specialty in neuroendocrinology and has been working in the field of nutrition—including nutrition research, education, medical writing, and clinical integrative and functional nutrition—for over 15 years.


